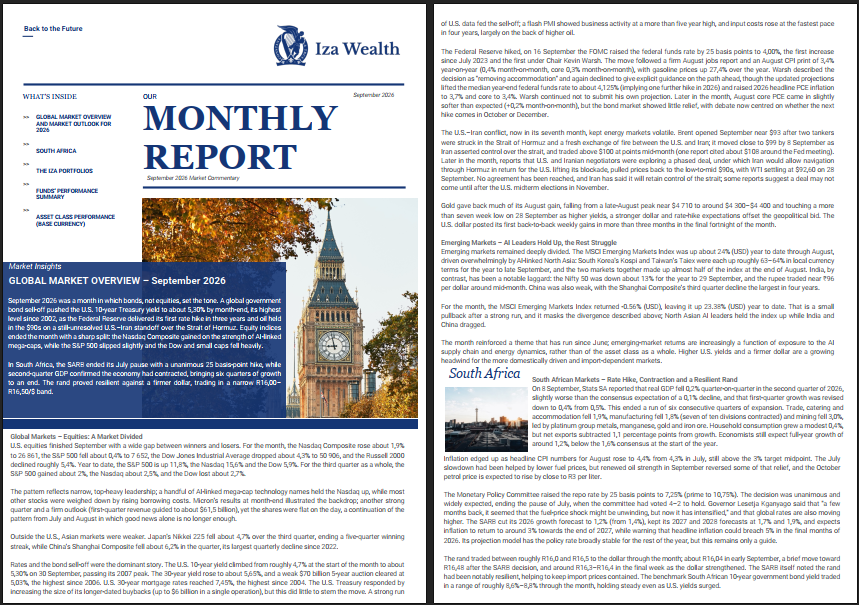
Our report is available below
Click the image to view/download the PDF
Market Insights
 September 2026 was a month in which bonds, not equities, set the tone. A global government bond sell-off pushed the U.S. 10-year Treasury yield to about 5,30% by month-end, its highest level since 2002, as the Federal Reserve delivered its first rate hike in three years and oil held in the $90s on a still-unresolved U.S.–Iran standoff over the Strait of Hormuz. Equity indices ended the month with a sharp split: the Nasdaq Composite gained on the strength of AI-linked mega-caps, while the S&P 500 slipped slightly and the Dow and small caps fell heavily.
In South Africa, the SARB ended its July pause with a unanimous 25 basis-point hike, while second-quarter GDP confirmed the economy had contracted, bringing six quarters of growth to an end. The rand proved resilient against a firmer dollar, trading in a narrow R16,00–R16,50/$ band.
Global Markets – Equities: A Market Divided
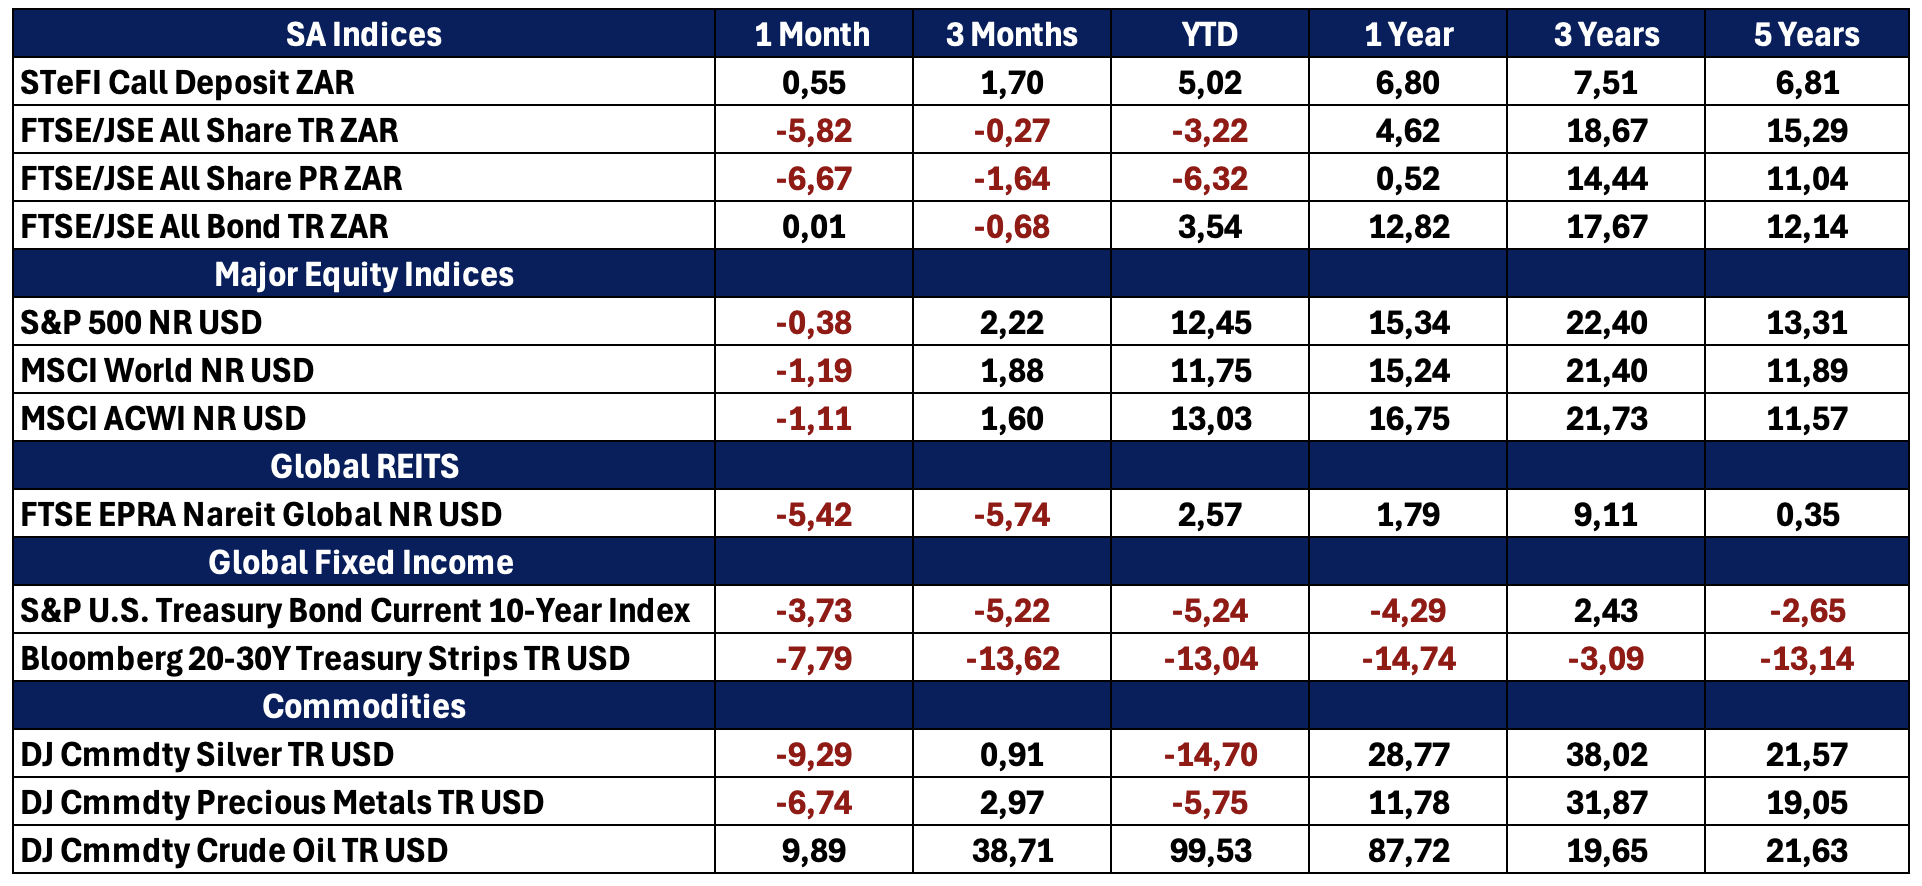
U.S. equities finished September with a wide gap between winners and losers. For the month, the Nasdaq Composite rose about 1,9% to 26 861, the S&P 500 fell about 0,4% to 7 652, the Dow Jones Industrial Average dropped about 4,3% to 50 906, and the Russell 2000 declined roughly 5,4%. Year to date, the S&P 500 is up 11,8%, the Nasdaq 15,6% and the Dow 5,9%. For the third quarter as a whole, the S&P 500 gained about 2%, the Nasdaq about 2,5%, and the Dow lost about 2,7%.
The pattern reflects narrow, top-heavy leadership; a handful of AI-linked mega-cap technology names held the Nasdaq up, while most other stocks were weighed down by rising borrowing costs. Micron’s results at month-end illustrated the backdrop; another strong quarter and a firm outlook (first-quarter revenue guided to about $61,5 billion), yet the shares were flat on the day, a continuation of the pattern from July and August in which good news alone is no longer enough.
Outside the U.S., Asian markets were weaker. Japan’s Nikkei 225 fell about 4,7% over the third quarter, ending a five-quarter winning streak, while China’s Shanghai Composite fell about 6,2% in the quarter, its largest quarterly decline since 2022.
Rates and the bond sell-off were the dominant story. The U.S. 10-year yield climbed from roughly 4,7% at the start of the month to about 5,30% on 30 September, passing its 2007 peak. The 30-year yield rose to about 5,65%, and a weak $70 billion 5-year auction cleared at 5,03%, the highest since 2006. U.S. 30-year mortgage rates reached 7,45%, the highest since 2004. The U.S. Treasury responded by increasing the size of its longer-dated buybacks (up to $6 billion in a single operation), but this did little to stem the move. A strong run of U.S. data fed the sell-off; a flash PMI showed business activity at a more than five year high, and input costs rose at the fastest pace in four years, largely on the back of higher oil.
The Federal Reserve hiked, on 16 September the FOMC raised the federal funds rate by 25 basis points to 4,00%, the first increase since July 2023 and the first under Chair Kevin Warsh. The move followed a firm August jobs report and an August CPI print of 3,4% year-on-year (0,4% month-on-month, core 0,3% month-on-month), with gasoline prices up 27,4% over the year. Warsh described the decision as “removing accommodation” and again declined to give explicit guidance on the path ahead, though the updated projections lifted the median year-end federal funds rate to about 4,125% (implying one further hike in 2026) and raised 2026 headline PCE inflation to 3,7% and core to 3,4%. Warsh continued not to submit his own projection. Later in the month, August core PCE came in slightly softer than expected (+0,2% month-on-month), but the bond market showed little relief, with debate now centred on whether the next hike comes in October or December.
The U.S.–Iran conflict, now in its seventh month, kept energy markets volatile. Brent opened September near $93 after two tankers were struck in the Strait of Hormuz and a fresh exchange of fire between the U.S. and Iran; it moved close to $99 by 8 September as Iran asserted control over the strait, and traded above $100 at points mid-month (one report cited about $108 around the Fed meeting). Later in the month, reports that U.S. and Iranian negotiators were exploring a phased deal, under which Iran would allow navigation through Hormuz in return for the U.S. lifting its blockade, pulled prices back to the low-to-mid $90s, with WTI settling at $92,60 on 28 September. No agreement has been reached, and Iran has said it will retain control of the strait; some reports suggest a deal may not come until after the U.S. midterm elections in November.
Gold gave back much of its August gain, falling from a late-August peak near $4 710 to around $4 300–$4 400 and touching a more than seven week low on 28 September as higher yields, a stronger dollar and rate-hike expectations offset the geopolitical bid. The U.S. dollar posted its first back-to-back weekly gains in more than three months in the final fortnight of the month.
Emerging Markets – AI Leaders Hold Up, the Rest Struggle
Emerging markets remained deeply divided. The MSCI Emerging Markets Index was up about 24% (USD) year to date through August, driven overwhelmingly by AI-linked North Asia: South Korea’s Kospi and Taiwan’s Taiex were each up roughly 63–64% in local currency terms for the year to late September, and the two markets together made up almost half of the index at the end of August. India, by contrast, has been a notable laggard: the Nifty 50 was down about 13% for the year to 29 September, and the rupee traded near ₹96 per dollar around mid-month. China was also weak, with the Shanghai Composite’s third quarter decline the largest in four years.
For the month, the MSCI Emerging Markets Index returned -0.56% (USD), leaving it up 23.38% (USD) year to date. That is a small pullback after a strong run, and it masks the divergence described above; North Asian AI leaders held the index up while India and China dragged.
The month reinforced a theme that has run since June; emerging-market returns are increasingly a function of exposure to the AI supply chain and energy dynamics, rather than of the asset class as a whole. Higher U.S. yields and a firmer dollar are a growing headwind for the more domestically driven and import-dependent markets.
South Africa

South African Markets – Rate Hike, Contraction and a Resilient Rand
On 8 September, Stats SA reported that real GDP fell 0,2% quarter-on-quarter in the second quarter of 2026, slightly worse than the consensus expectation of a 0,1% decline, and that first-quarter growth was revised down to 0,4% from 0,5%. This ended a run of six consecutive quarters of expansion. Trade, catering and accommodation fell 1,9%, manufacturing fell 1,8% (seven of ten divisions contracted) and mining fell 3,0%, led by platinum group metals, manganese, gold and iron ore. Household consumption grew a modest 0,4%, but net exports subtracted 1,1 percentage points from growth. Economists still expect full-year growth of around 1,2%, below the 1,6% consensus at the start of the year.
Inflation edged up as headline CPI numbers for August rose to 4,4% from 4,3% in July, still above the 3% target midpoint. The July slowdown had been helped by lower fuel prices, but renewed oil strength in September reversed some of that relief, and the October petrol price is expected to rise by close to R3 per liter.
The Monetary Policy Committee raised the repo rate by 25 basis points to 7,25% (prime to 10,75%). The decision was unanimous and widely expected, ending the pause of July, when the committee had voted 4–2 to hold. Governor Lesetja Kganyago said that “a few months back, it seemed that the fuel-price shock might be unwinding, but now it has intensified,” and that global rates are also moving higher. The SARB cut its 2026 growth forecast to 1,2% (from 1,4%), kept its 2027 and 2028 forecasts at 1,7% and 1,9%, and expects inflation to return to around 3% towards the end of 2027, while warning that headline inflation could breach 5% in the final months of 2026. Its projection model has the policy rate broadly stable for the rest of the year, but this remains only a guide.
The rand traded between roughly R16,0 and R16,5 to the dollar through the month; about R16,04 in early September, a brief move toward R16,48 after the SARB decision, and around R16,3–R16,4 in the final week as the dollar strengthened. The SARB itself noted the rand had been notably resilient, helping to keep import prices contained. The benchmark South African 10-year government bond yield traded in a range of roughly 8,6%–8,8% through the month, holding steady even as U.S. yields surged.
The JSE All Share Index fell 5,82% in September, one of its weakest months of the year, and is now down 3,22% year to date. The sell-off came despite a steady rand and stable local bond yields, pointing to a combination of weaker commodity-linked shares as gold retreated, the contraction in second-quarter GDP and the SARB’s rate hike weighing on domestic sentiment.
Special Themes and Policy Watch
A Global Bond Sell-Off Takes Centre Stage
The 10-year U.S. Treasury yield above 5,3% is the highest since 2002, and long-dated yields have pushed globally higher. Markets are now being driven as much by the cost of capital as by earnings, and stretched valuations are less forgiving of rising yields.
The Fed Moves From Pause to Hike
The September hike confirmed the regime shift that Warsh’s Jackson Hole speech signalled in August; a Fed focused on prices, light on forward guidance, and willing to act. Projections now point to at least one further hike, and the committee has not ruled out October.
Narrow Leadership Persists
The gap between the Nasdaq (up) and the Dow and Russell 2000 (down sharply) in a single month is among the clearest signs yet of concentration risk: strong index-level headlines are masking weak breadth.
Hormuz: Diplomacy vs. Escalation
Oil spent the month moving between talk of a phased reopening of the strait and renewed attacks on tankers. A deal remains uncertain, and the political calendar (U.S. midterm elections in November) is now part of the market’s calculus.
South Africa: Growth Down, Rates Up
A contracting economy (Q2 GDP −0,2%) alongside a hiking central bank (repo 7,25%) is a difficult combination. The SARB is explicitly “looking through” the fuel shock to protect the inflation target, even as it cuts its growth forecast.
Closing Remarks
September 2026 showed that the pressure on markets had moved from the oil price to the price of money. A Fed that is now hiking, a bond market that is demanding higher yields, and a still-unresolved Middle East conflict combined to leave most equity markets flat to lower, even as a narrow group of AI-linked companies kept the Nasdaq in positive territory. For South Africa, the combination of a hiking SARB, a contracting economy and a stronger global dollar is challenging, but the resilience of the rand has so far prevented the external shock from compounding the domestic one. For investors, the message of the past four months holds: this is an environment in which diversification, valuation discipline and a focus on quality balance sheets matter more than ever.
The Iza Portfolios
Iza Global Balanced Fund
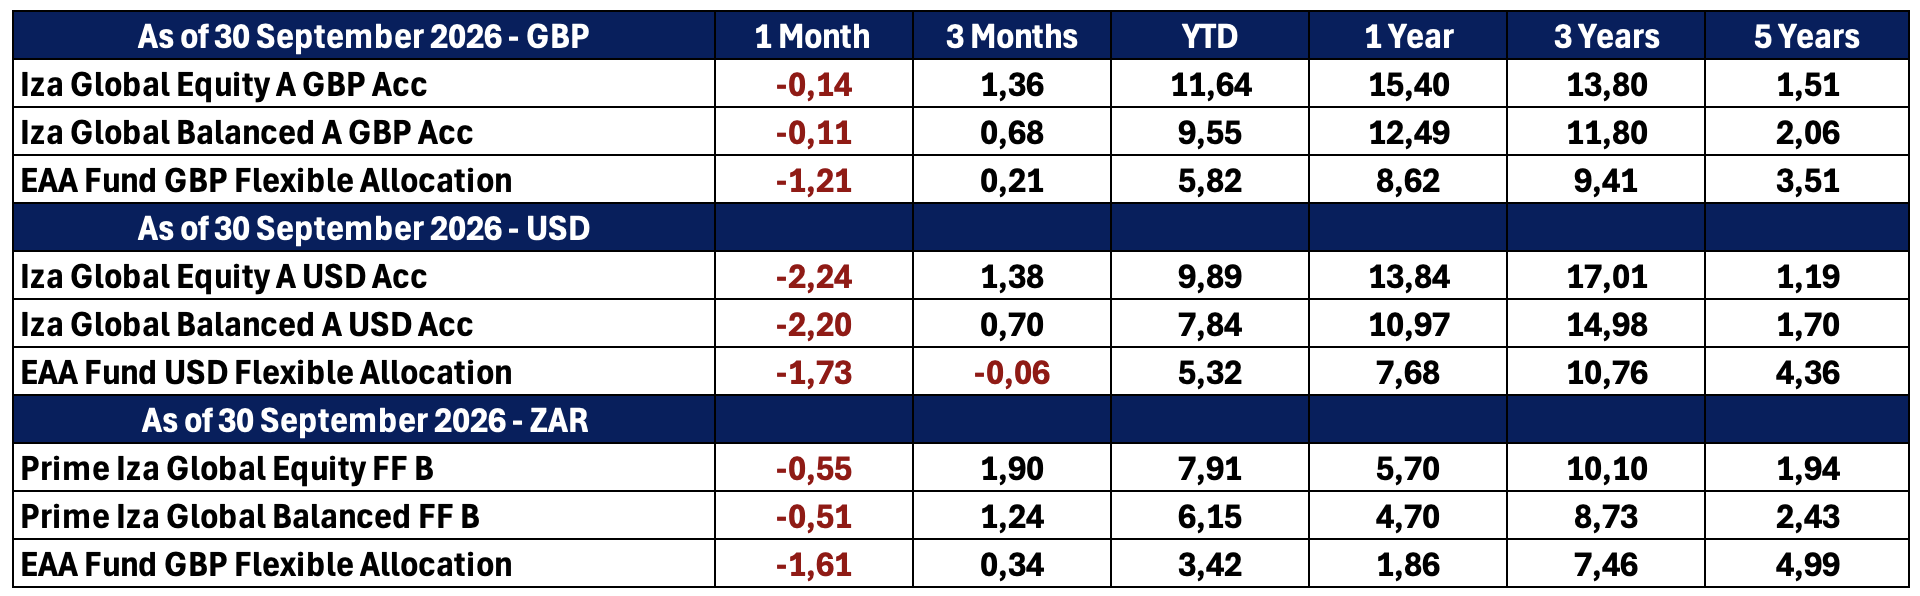
The Iza Global Balanced Fund delivered a return of -0,11% (GBP) and -2,20% (USD) during September, bringing its year-to-date return to 9,55% (GBP) and 7,84% (USD). Despite the modest decline during the month, the Fund continued to outperform its peer benchmark on a month-to-date basis (benchmark returns of -1,21% (GBP) and -1,74% (USD)) and extended its outperformance on a year-to-date basis (benchmark returns of 5,65% (GBP) and 4,86% (USD)). Longer-term performance also remained well ahead of benchmark, with Fund returns of 12,49% (GBP) and 10,97% (USD) over one year (versus benchmark returns of 8,61% (GBP) and 7,67% (USD)) and 20,97% (GBP) and 19,98% (USD) over two years (versus benchmark returns of 16,34% (GBP) and 17,11% (USD)).
Following a strong rebound in August, September saw renewed weakness in gold and several structured note and equity allocations, offsetting gains elsewhere in the portfolio. The strongest performing underlying holdings during the month were the Santander Note (NKY/SX5E/MXEF), delivering a positive return of 3,47%, the T Rowe Price Global Focused Growth Equity Fund, delivering a return of 3,42%, and the CITIGROUP Bearish S&P Note, delivering a return of 0,72%.
In September our top contributions to performance were from the T Rowe Price Global Focused Growth Equity Fund, which contributed 0,25%, and the MSCI World USD allocation, which contributed 0,13%. The main detractors to contribution were the Dodge & Cox Stock Fund, which subtracted -0,31%, Ranmore Global Equity, which subtracted -0,16%, and gold, which subtracted -0,15%.
In summary, the Fund declined modestly by -0,11% (GBP) and -2,20% (USD) in September, following a strong rebound in August. The primary drivers of the decline were weakness in the Dodge & Cox Stock Fund, Ranmore Global Equity and gold, which gave back some of its recent gains. Positive contributions from the T Rowe Price Global Focused Growth Equity Fund and the MSCI World USD allocation helped offset a portion of the negative returns. Despite the pullback, the Fund remains strongly positive for the year, with a year-to-date return of 9,55% (GBP) and 7,84% (USD), well ahead of its benchmarks at 5,65% (GBP) and 4,86% (USD). Overall, September represented a brief pause following August’s strong recovery, with diversified positioning helping to limit downside while preserving attractive year-to-date returns. The portfolio continues to maintain a balanced approach, combining growth opportunities with diversification through alternative investments, structured products, money market exposure and cash holdings.
Iza Global Equity Fund
The Iza Global Equity Fund delivered a return of -0,14% (GBP) and -2,24% (USD) during September, bringing its year-to-date return to 11,64% (GBP) and 9,90% (USD). The Fund underperformed its benchmark, the MSCI ACWI Index, during the month in both currencies (benchmark returns of 0,92% (GBP) and -1,11% (USD) in GBP terms), and persisted on a year-to-date basis (benchmark returns of 13,63% (GBP) and 12,25% (USD)). The Fund returned 15,40% (GBP) and 13,84% (USD) over one year (versus benchmark returns of 18,32% (GBP) and 16,75% (USD)) and 24,57% (GBP) and 23,55% (USD) over two years (versus benchmark returns of 38,24% (GBP) and 36,92% (USD)).
September brought a more mixed month for the underlying managers, with weakness in Northstar Global Equity and the Dodge & Cox Stock Fund offsetting continued strength from the Fund’s recent top performers. The strongest performing underlying holdings during the month were the T Rowe Price Global Focused Growth Equity Fund, delivering a positive return of 3,42%, Guinness Global Innovation, delivering a return of 2,67%, and Templeton Emerging Markets, delivering a return of 1,77%.
In September, our top contributions to performance came from the T Rowe Price Global Focused Growth Equity Fund, which contributed 0,25%, and Guinness Global Innovation, which contributed 0,13%. The main detractors to contribution were Northstar Global Equity, which subtracted -0,35%, Ranmore Global Equity, which subtracted -0,22%, and the Dodge & Cox Stock Fund, which subtracted -0,31%.
In summary, the Fund declined modestly by -0,14% (GBP) and -2,24% (USD) in September, as weakness in Northstar Global Equity, the Dodge & Cox Stock Fund and Ranmore Global Equity outweighed positive contributions from the T Rowe Price Global Focused Growth Equity Fund and Guinness Global Innovation. The Fund’s year-to-date return now stands at 11,64% (GBP) and 9,90% (USD), though it continues to trail its benchmark, which returned 13,63% (GBP) and 12,25% (USD) over the same period, as well as over the one- and two-year periods. Overall, September was a largely flat month for the Fund, with stock-specific weakness in a handful of core holdings offsetting gains elsewhere, and the persistent gap to the MSCI ACWI benchmark remains the key theme to monitor. The portfolio continues to maintain a multi-manager approach designed to deliver long-term outperformance of the MSCI ACWI Index, while managing short-term volatility through manager diversification.
Quote of the month
The individual investor should act consistently as an investor and not as a speculator.
Benjamin Graham
Funds’ Performance Summary
Asset Class Performance (Base Currency)