The Fund aims to achieve returns in excess of MSCI All Country World Index p.a. over rolling six-year periods. Fund returns will be generated through dividend income and capital growth. The Fund is a multi-manager Fund ideally comprising at least two underlying funds. Fund selection will be bias towards funds with outperformance of benchmark and to managers whose objective is to achieve long term growth. Where possible underlying funds will be given as many of the equity sector allocation decisions as possible. Underlying investments may be denominated in multiple first world currencies; however, all performance and risk statistics will be measured in the applicable currency. The Fund will, apart from liquid assets, consists of listed equities, bonds, property, equity and money-market instruments as well as participatory interests in collective investment schemes, including exchange traded funds (“Collective Investment Schemes”). The Fund is aimed at investors with a long-term (6 years or more) investment time horizon. This Fund is best suited for investors who can accept some volatile capital movements but seek returns in excess of MSCI All Country World Index over rolling 6-year periods.
Investment Objective and Strategy
Download Fund factsheet
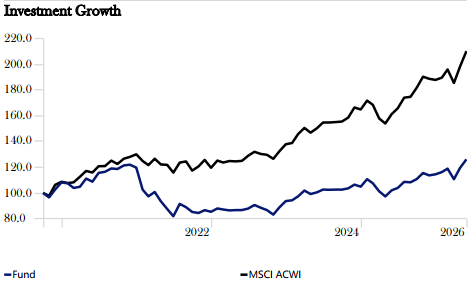
Cumulative Growth Since Inception (GBP)
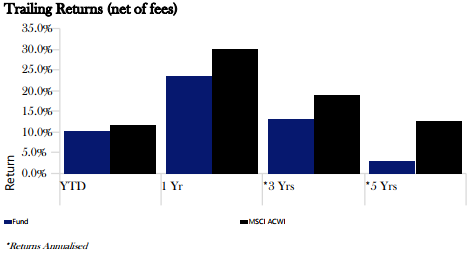
Trailing Returns (GBP)
Risk Measures
| Risk Metrics | Fund | MSCI ACWI |
|---|---|---|
| Standard Deviation* | 14.8 | 11.6 |
| Sharpe Ratio* | 0.0 | 0.7 |
| Sortino Ratio* | 0.3 | 1.1 |
*Annualised
Periodic Return (GBP)
| Period | Fund | MSCI ACWI |
|---|---|---|
| 1 Month | 5.5 | 6.0 |
| 3 Months | 6.1 | 7.3 |
| 6 Months | 11.0 | 11.4 |
| YTD | 10.2 | 11.9 |
| 1 Year | 23.6 | 30.3 |
| 3 Years | 13.3 | 18.9 |
| 5 Years | 3.0 | 12.6 |
| Since Inception | 4.9 | 14.7 |
Asset Allocation
Equity Exposure
| Weight % | |
|---|---|
| Taiwan Semiconductor Manufacturing Co Ltd |
2.5 |
| NVIDIA Corp |
2.4 |
| Microsoft Corp |
2.0 |
| Apple Inc |
1.7 |
| Amazon.com Inc |
1.7 |
| SpaceX |
1.5 |
| Broadcom Inc |
1.4 |
| Alphabet Inc Class A |
1.2 |
| Samsung Electronics Co Ltd |
1.1 |
| SK Hynix Inc |
1.1 |
Top 10 Holdings
| Equity Econ Sector | % |
|---|---|
| Financial Services |
15.1 |
| Healthcare |
10.9 |
| Technology |
28.1 |
| Consumer Cyclical |
11.9 |
| Consumer Defensive |
5.5 |
| Communication Services |
8.8 |
| Industrials |
12.5 |
| Energy |
2.6 |
| Basic Materials |
2.3 |
| Utilities |
1.0 |
| Real Estate |
1.2 |
Monthly Portfolio Net Returns (GBP)
| Jan | Feb | Mar | Apr | May | Jun | Jul | Aug | Sep | Oct | Nov | Dec | YTD | B-Mark | — | |
|---|---|---|---|---|---|---|---|---|---|---|---|---|---|---|---|
| 2026 | 1.5 | 2.3 | -6.9 | 8.0 | 5.5 | 10.2 | 11.9 | — | |||||||
| 2025 | 5.5 | -2.9 | -5.8 | -3.9 | 4.9 | 1.9 | 4.5 | -0.3 | 2.3 | 4.3 | -1.6 | 0.7 | 9.1 | 13.9 | — |
| 2024 | 0.66 | 3.22 | 4.65 | -2.69 | 1.36 | 2.1 | -0.2 | 0.2 | 0.0 | 1.0 | 2.8 | -1.5 | 11.9 | 19.6 | — |
| 2023 | 3.03 | -0.93 | -0.80 | 0.27 | 0.06 | 1.30 | 3.20 | -2.37 | -2.06 | -4.06 | 6.82 | 5.45 | 9.74 | 16.81 | — |
| 2022 | -14.28 | -5.06 | 3.45 | -7.17 | -6.40 | -6.41 | 11.71 | -2.82 | -4.15 | -0.93 | 2.59 | -1.45 | -28.65 | -7.83 | 18.54 |
| 2021 | -0.78 | -3.28 | 0.92 | 6.04 | -2.17 | 6.27 | 0.74 | 2.21 | -0.35 | 2.34 | 0.48 | -1.86 | 10.56 | 23.12 | 20.46 |
| 2020 | 0.94 | -5.79 | -1.49 | 10.21 | 7.51 | 4.97 | 1.57 | 5.60 | 1.60 | -3.45 | 6.38 | 5.39 | 37.44 | 12.32 | 7.59 |
| 2019 | 3.6 | 2.6 | 3.6 | 2.9 | -0.9 | 3.2 | 4.61 | -2.09 | -2.43 | -2.09 | 2.16 | 2.31 | 18.64 | 22.74 | 8.30 |
| 2018 | 1.3 | 0.3 | -2.8 | 2.9 | 5.0 | 1.5 | 1.9 | 2.5 | -0.6 | -8.0 | 3.4 | -6.2 | 0.3 | -3.04 | 9.10 |
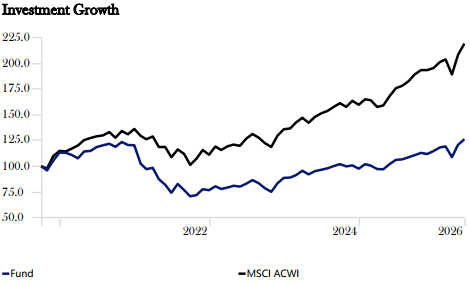
Cumulative Growth Since Inception (USD)
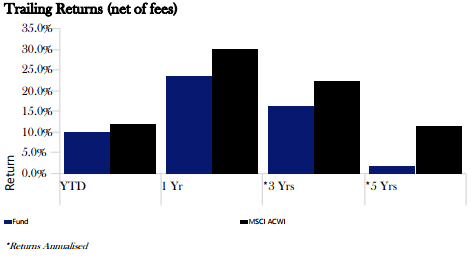
Trailing Returns (USD)
Risk Measures
| Risk Metrics | Fund | MSCI ACWI |
|---|---|---|
| Standard Deviation* | 17.8 | 15.2 |
| Sharpe Ratio* | 0.1 | 0.6 |
| Sortino Ratio* | 0.4 | 1.2 |
*Annualised
Periodic Returns (USD)
| Period | Fund | MSCI ACWI |
|---|---|---|
| 1 Month | 4.4 | 5.2 |
| 3 Months | 5.9 | 7.5 |
| 6 Months | 12.8 | 13.3 |
| YTD | 10.0 | 12.1 |
| 1 Year | 23.6 | 30.3 |
| 3 Years | 16.3 | 22.3 |
| 5 Years | 1.9 | 11.5 |
| Since Inception | 5.0 | 15.5 |
Top 10 Holdings
| Weight % | |
|---|---|
| Taiwan Semiconductor Manufacturing Co Ltd |
2.5 |
| NVIDIA Corp |
2.4 |
| Microsoft Corp |
2.0 |
| Apple Inc |
1.7 |
| Amazon.com Inc |
1.7 |
| SpaceX |
1.5 |
| Broadcom Inc |
1.4 |
| Alphabet Inc Class A |
1.2 |
| Samsung Electronics Co Ltd |
1.1 |
| SK Hynix Inc |
1.1 |
Equity Exposure
| Equity Econ Sector | % |
|---|---|
| Financial Services |
15.1 |
| Healthcare |
10.9 |
| Technology |
28.1 |
| Consumer Cyclical |
11.9 |
| Consumer Defensive |
5.5 |
| Communication Services |
8.8 |
| Industrials |
12.5 |
| Energy |
2.6 |
| Basic Materials |
2.3 |
| Utilities |
1.0 |
| Real Estate |
1.2 |
Asset Allocation
Monthly Portfolio Net Returns (USD)
| Jan | Feb | Mar | Apr | May | Jun | Jul | Aug | Sep | Oct | Nov | Dec | YTD | B-Mark | US CPI + 7% | |
|---|---|---|---|---|---|---|---|---|---|---|---|---|---|---|---|
| 2026 | 3.1 | 0.8 | -8.7 | 11.1 | 4.4 | 10.0 | 12.1 | — | |||||||
| 2025 | 4.5 | -1.5 | -3.3 | -0.2 | 5.3 | 3.9 | 0.5 | 1.9 | 1.9 | 2.0 | -1.0 | 2.6 | 17.5 | 22.3 | — |
| 2024 | 0.33 | 2.70 | 4.64 | -3.70 | 3.4 | 1.4 | 1.5 | 2.3 | 1.9 | -2.2 | 1.0 | -3.2 | 10.1 | 17.5 | — |
| 2023 | 5.05 | -3.33 | 1.79 | 2.16 | -0.96 | 3.43 | 4.29 | -3.61 | -5.72 | -4.43 | 10.95 | 6.34 | 15.60 | 23.79 | — |
| 2022 | -14.80 | -5.27 | 1.34 | -11.19 | -6.19 | -9.55 | 11.63 | -7.20 | -7.89 | 1.74 | 7.86 | -1.24 | -36.26 | -18.14 | 14.66 |
| 2021 | -0.28 | -1.80 | -2.97 | 6.19 | 0.44 | 3.29 | 1.43 | 1.25 | -2.46 | 3.97 | -2.37 | -0.19 | 6.23 | 21.82 | 13.81 |
| 2020 | 0.46 | -8.58 | -4.23 | 12.04 | 5.45 | 4.91 | 7.64 | 7.67 | -1.78 | -4.09 | 9.79 | 7.60 | 40.61 | 15.90 | 8.30 |
| 2019 | 6.78 | 3.95 | 2.58 | 3.34 | -3.50 | 4.68 | 1.44 | -2.88 | -1.85 | 2.53 | 2.56 | 5.62 | 27.65 | 27.67 | 9.26 |
| 2018 | 6.27 | -3.06 | -1.31 | 2.74 | 3.29 | 1.83 | 0.98 | 2.85 | -0.55 | -9.54 | 3.06 | -5.48 | -0.01 | -8.71 | 8.92 |
Returns are based on the strategic underlying weightings of the funds and will not exactly reflect individual client returns. All returns are net of fund management fees, but exclude advice and administration fees. Prior to portfolio launch date, the performance is pro-forma using the actual underlying fund performances and is net of all fees and expenses.
*The performance information is based on the back-tested performance of hypothetical investments over the time periods indicated. “Back-testing” is a process of objec-tively simulating historical investment returns by applying a set of rules for buying and selling securities, and other assets, backward in time, testing those rules, and hypo-thetically investing in the securities and other assets that are chosen. Back-testing is designed to allow investors to understand and evaluate certain strategies by seeing how they would have performed hypothetically during certain time periods. While back-testing results reflect rigorous application of the investment strategy selected, back-tested results have certain limitations and should not be considered indica-tive of future results. The results achieved in our simulations do not guarantee future investment results.
Download Fund factsheet
Sign up to our newsletter!
Keep updated on how best to create wealth and protect it for the future.